Frequently asked questions are answered below. Just click on the respective question to show the answer. We encourage new users to study especially the questions related to interpretation of the results. Please also refer to the help section for more comprehensive elucidations.
Errors during the upload of a PDB file can have several reasons. To read PDB files, they have to be well-formed and correctly formatted. Further, there need to be Cα atoms present for the residues of interest. If parsing fails for any reason, an exception will occur, which may give a clue why the problem occurred. Additionally, the PDB file upload is restricted to the file ending *.pdb (not *.pdb.txt, which may be masked as *.pdb by the operating system) and to a maximum file size of 10MB for motif extraction and 1MB for motif submission.
Fit3D only accepts plain text target lists that have the extension *.txt and a file size below 1MB. All target structures must be separated by a line break and identified by their four-character PDB-ID (e.g. 4cha). If chain IDs are omitted, Fit3D will use all chains during the search to discover inter-molecular matches. If chains are specified (separated by tabulator, e.g. 4cha[tabulator]A), only these chains are used during searching. The target list is only allowed to either contain PDB-IDs without chain ID, or PDB-IDs with chain ID. Mixing of entries with and without chain ID is not permitted.
Fit3D rates the query motif according to the estimated
computational complexity of the search task into three
categories: low (
 ), medium (
 ) and high (
 ). The estimation depends on the spatial extent of the motif and
the number of different residue types. Due to limited
computational resources of the web server, query motifs rated with
high complexity are not accepted for calculation. We encourage
users to use the
API
for such calculations. Furthermore, the total number of
position-specific exchangeDefinitions (PSEs) is restricted to three, as
PSEs heavily increase computational complexity.
). The estimation depends on the spatial extent of the motif and
the number of different residue types. Due to limited
computational resources of the web server, query motifs rated with
high complexity are not accepted for calculation. We encourage
users to use the
API
for such calculations. Furthermore, the total number of
position-specific exchangeDefinitions (PSEs) is restricted to three, as
PSEs heavily increase computational complexity.
If Fit3D reports less entries in your target list than you would expect, this is due to duplicate entries. Internally, Fit3D filters duplicate entries because it is not expedient to search the query motif repeatedly in the same structure (Fit3D is not a heuristic algorithm).
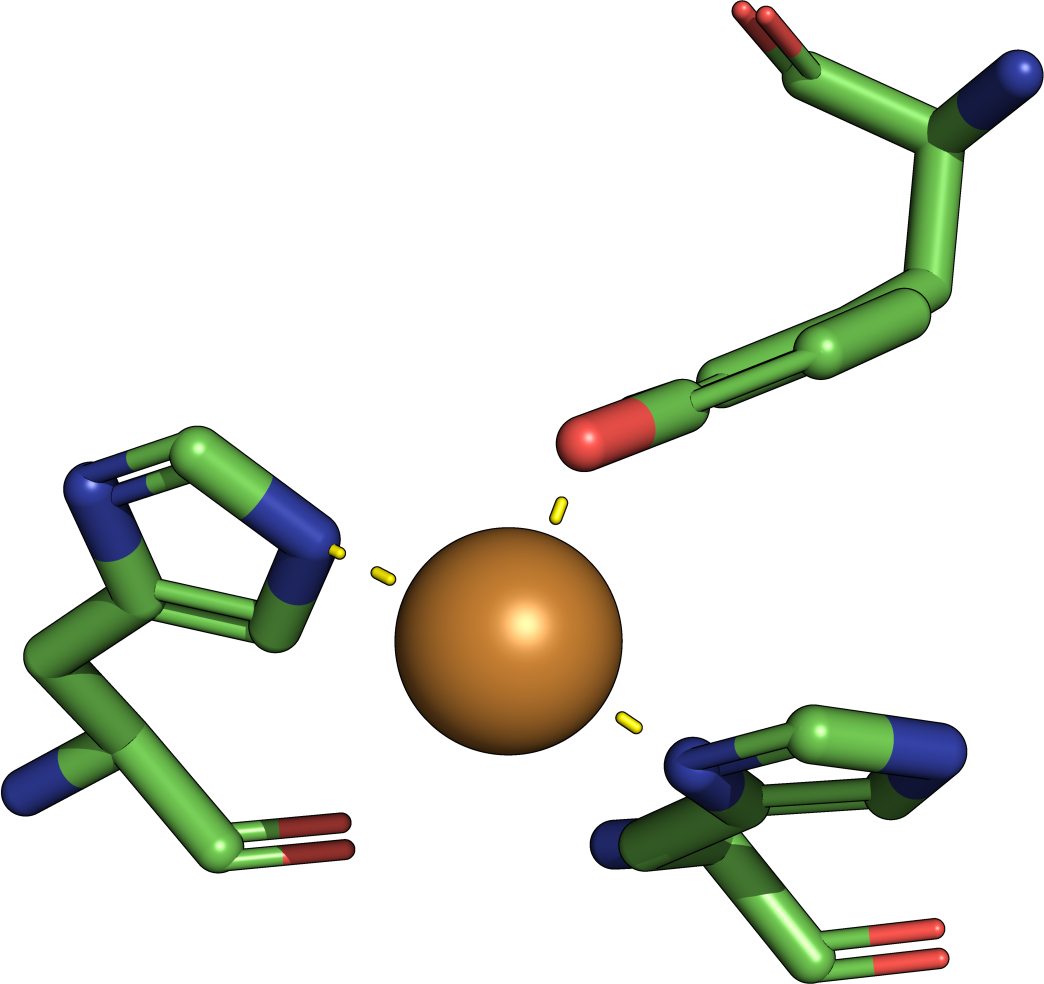
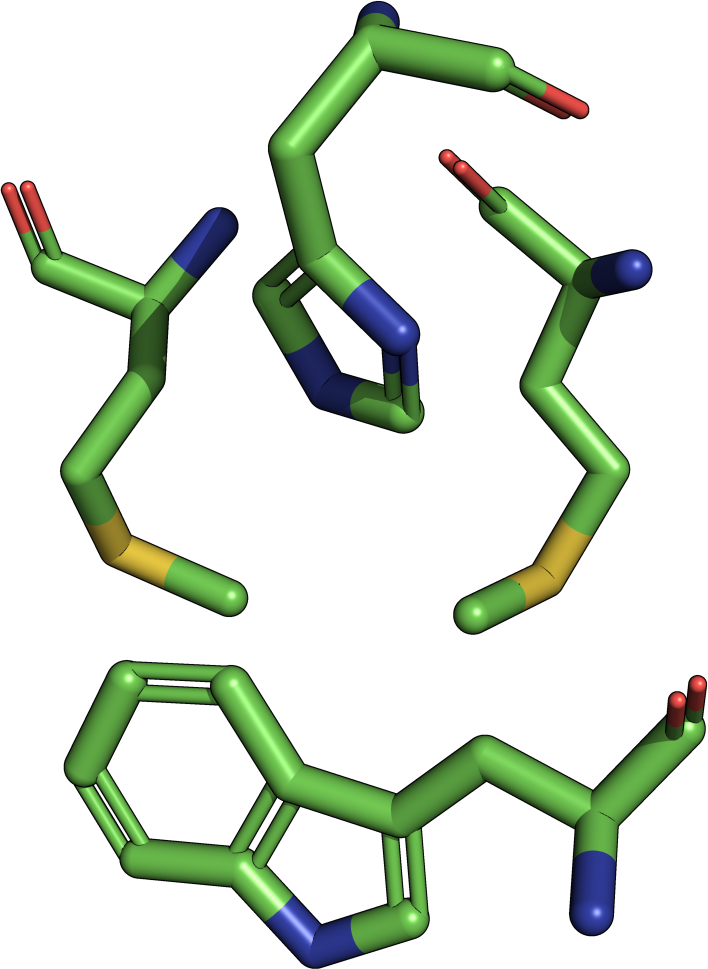
Even if it seems at a first glance that duplicate matches are reported by Fit3D, this is not the case. Fit3D does not consider protein chains individually due to its inter-molecular search approach (matches that spread multiple protein chains). Matches that are reported in homomeric structures can be misinterpreted as duplicate entries, e.g.
are not identical. One match occurs in chain A, whereas the other occurs in chain F. Also note the slightly different RMSD values. Such matches are not omitted internally, to be able to locate inter-molecular matches.
With increasing RMSD limit, more alignments have to be performed using Singular Value Decomposition (SVD). SVD minimizes the root-mean-square deviation between two sets of three-dimensional points of the same size. Consequently, the computational load is significantly increased. Please consider to use our command line implementation if a higher RMSD limit is desired. However, note that a lot of noise will occur for RMSD values above approximately 3 Å for small structural motifs. Please refer to the next question to understand the theory behind it.
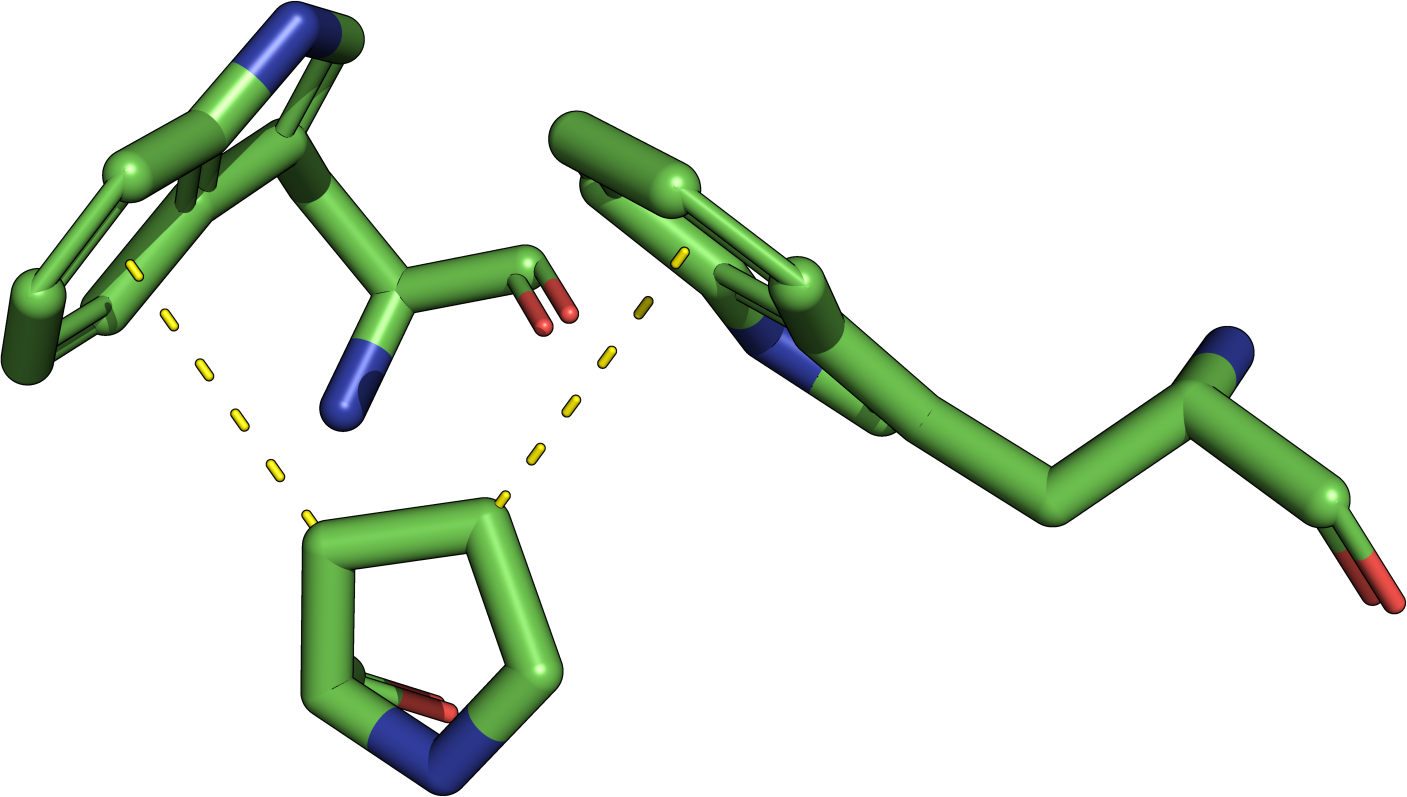
The least-root-mean-square deviation (RMSD) is the minimal
root-mean-square deviation of all possible alignments
(permutations) of two motifs. Due to the RMSD definition, it is
only possible to calculate an RMSD for two sets of points of the
same size. Additionally, the RMSD depends on the size of
the two point sets A and B: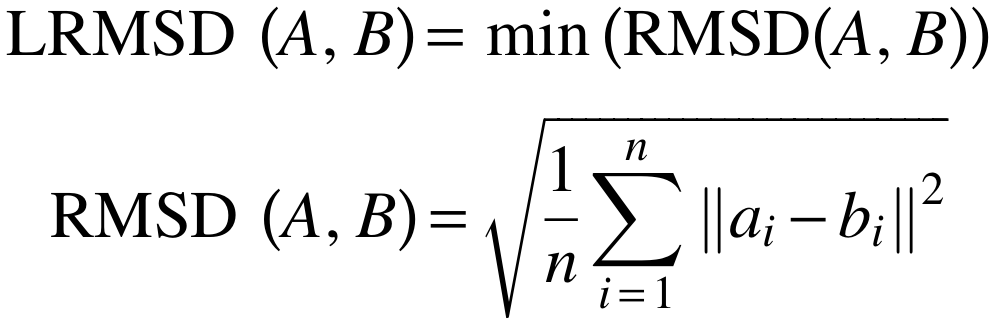 Consequently, structural motifs consisting of a small
amount of residue atoms will have a low RMSD if they have a good
agreement. In contrast, structural motifs consisting of more
residues still have a high structural similarity if the RMSD is
higher. Consider an agreement of the
4CHA
serine protease catalytic triad (the example job) of 2.0 Å to a
reported match. This is a poorer agreement than a match of 2.0 Å
against the five-residue enolase superfamily template.
Furthermore, the matching of different residue types when allowing
position-specific exchangeDefinitions (PSEs) is based on Cα atom comparison
due to incompatible sidechains. Hence, a match containing a PSE
and a similar RMSD is less reliable than a match without any
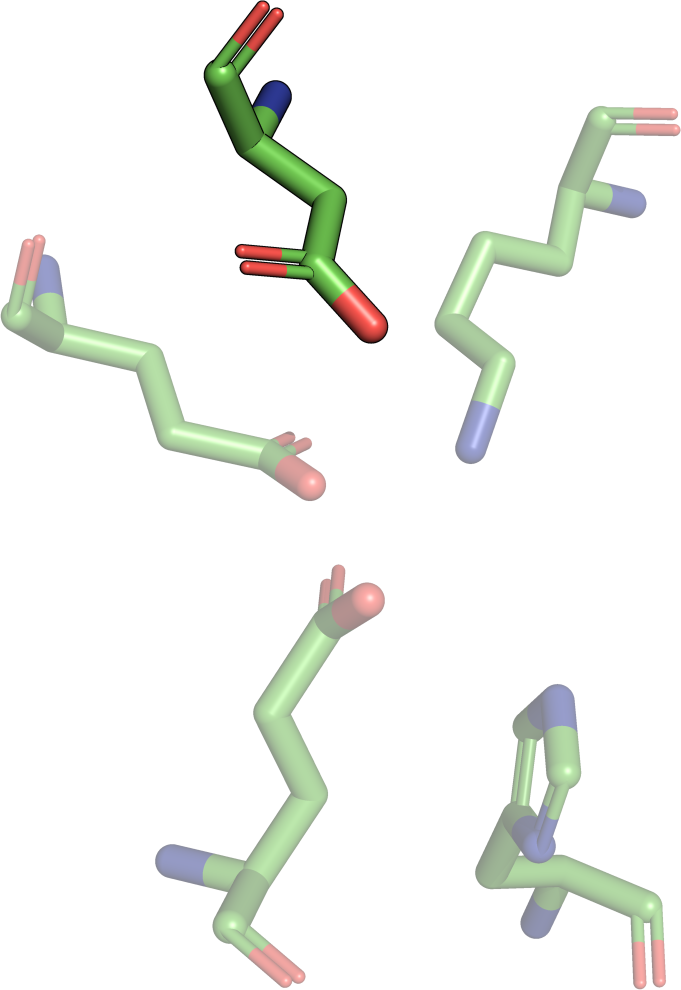
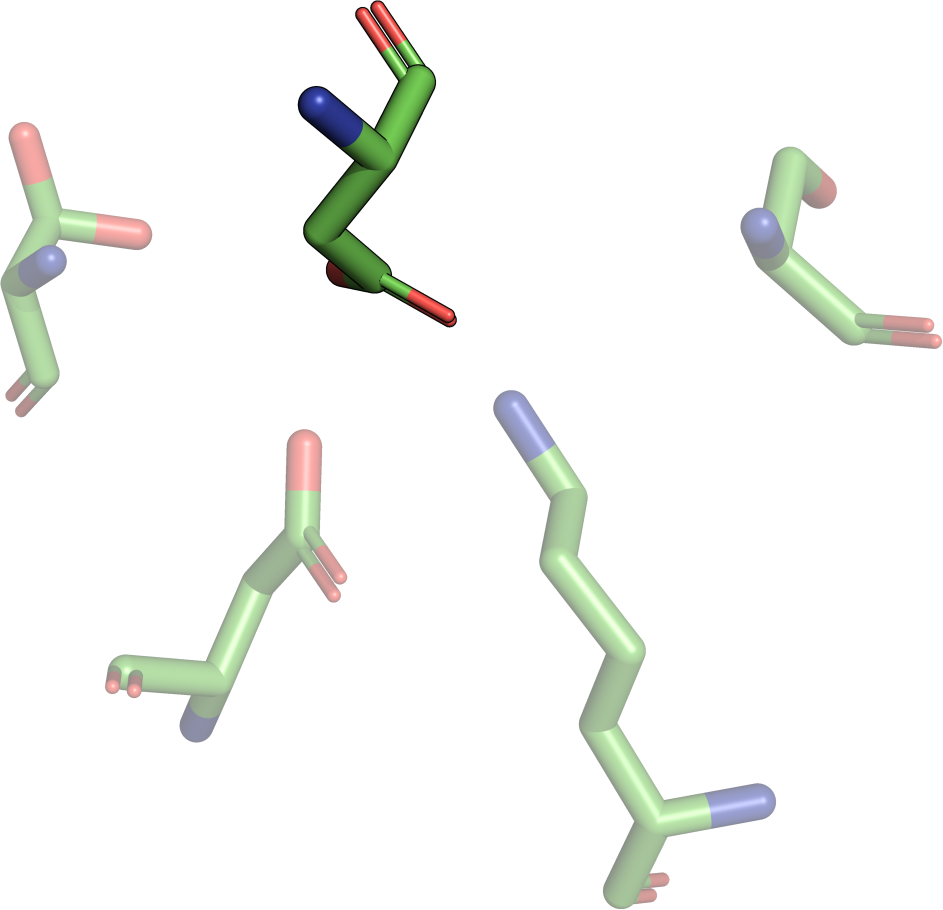
PSEs. To aid the assessment of match quality, the alignment
function should be used for visual inspection.
Consequently, structural motifs consisting of a small
amount of residue atoms will have a low RMSD if they have a good
agreement. In contrast, structural motifs consisting of more
residues still have a high structural similarity if the RMSD is
higher. Consider an agreement of the
4CHA
serine protease catalytic triad (the example job) of 2.0 Å to a
reported match. This is a poorer agreement than a match of 2.0 Å
against the five-residue enolase superfamily template.
Furthermore, the matching of different residue types when allowing
position-specific exchangeDefinitions (PSEs) is based on Cα atom comparison
due to incompatible sidechains. Hence, a match containing a PSE
and a similar RMSD is less reliable than a match without any
PSEs. To aid the assessment of match quality, the alignment
function should be used for visual inspection.
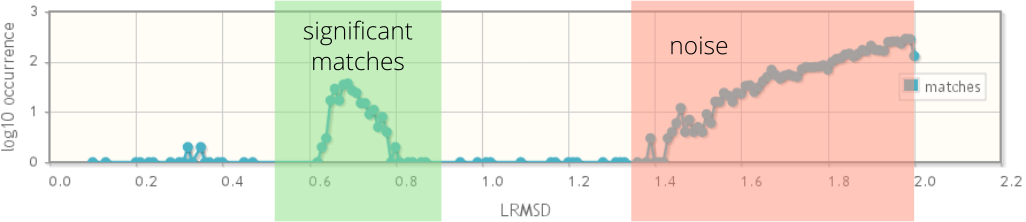
The RMSD plot depicts the distribution of the RMSD values of all matches within the RMSD limit. It was shown that significant matches tend to appear in the left region of this distribution and form a "significance peak". This peak is usually separated by an area where matches are sparse, followed by an exponentially increasing reporting of noise. The Figure below depicts the "ideal" RMSD distribution schematically.
The p-value is a measurement for the significance of a single match and is computed either by an empirical model (according to Stark et al. 2003) or by kernel density estimation of the RMSD distribution (according to Fofanov et al. 2008). The lower the p-value, the higher the statistical significance of a match . A "good" p-value should be significantly smaller than 0.1. The p-value represents the probability that a match of better agreement can be found. As for RMSD values, the p-value has to be treated carefully. Ideally, low p-values indicate matches within the "significance peak" of the RMSD distribution and therefore p-values are dependent on the RMSD values. The model according to Fofanov et al. is based on the RMSD distribution describing the current search results. This is generally more favorable than the approach of Stark et al. 2003, which approximates the RMSD distribution using an empirical derived model. In previous work we showed that approach of Fofanov et al. 2008 is also robust when considering different atoms for alignment and reliably identifies members of the enolase superfamily with 99.68% specificity when all non-hydrogen atoms are used for alignment (Kaiser et al. 2015 ). But nevertheless, cross-checking with the RMSD value, the RMSD distribution, and the visual alignment to assess a match is advisable in any case.
This depends on your demands for the motif search, so there is no general answer to this question. It can be meaningful to align on the basis of sidechain atoms, if the motif is expected to have large Cα variance, which is the case for enolase superfamily or other divergently evolved protein families. In turn, backbone-based alignment can be suitable if high sidechain variance is expected. A bad quality model structure that is used for query motif definition can be a scenario, where matching of Cα atoms may be reasonable. However, in general the method specificity experiences a loss if less atoms are considered for alignment. Therefore, the default non-hydrogen atom alignment should be used for most cases. For very special needs the command line implementation can be used, that allows the definition of arbitrary atoms (e.g. backbone nitrogen and Cβ atom only) Please refer to Kaiser et al. 2015 for further information on how different atom representations influences the quality of the method.