

Table of content
1. Globular proteins
1.1 Characterization of the average free energies
1.2 Quantitative distribution of the secondary structures within the four quantiles
1.3 Quantitative distribution of the aminoacids within the four quantiles
1.4 Energetical characterization of all aminoacids within the secondary structures
1.5 Quantitative distribution of all aminoacids within the secondary structures
1.6 Energetical characterization of the 3D-motifs
1.7 Quantitative distribution of the 3D-motifs
1.8 Quantitative distribution of the phi-angle within the four quantiles and the secondary structures
1.9 Quantitative distribution of the psi-angle within the four quantiles and the secondary structures
2. Membrane proteins
2.1 Characterization of the average free energies
2.2 Quantitative distribution of the secondary structures within the four quantiles
2.3 Quantitative distribution of the aminoacids within the four quantiles
2.4 Energetical characterization of all aminoacids within the secondary structures
2.5 Quantitative distribution of all aminoacids within the secondary structures
1. Globular proteins
1.1 Average coarse energy according to amino acid
Dataset: 2700 non-redundant globular proteins
| avg. coarse-grained energy | avg. coarse-grained energy | ||
| Ala | -14.71 | Leu | -25.33 |
| Arg | -5.94 | Lys | -0.74 |
| Asn | -4.33 | Met | -24.21 |
| Asp | -1.83 | Phe | -25.68 |
| Cys | -26.03 | Pro | -5.45 |
| Gln | -5.30 | Ser | -6.93 |
| Glu | -0.88 | Thr | -8.40 |
| Gly | -7.62 | Trp | -20.49 |
| His | -12.60 | Tyr | -19.64 |
| Ile | -27.33 | Val | -22.60 |
1.2 Quantitative distribution of the secondary structures within the four quantiles
Dataset: 114 non-redundant globular proteins
| 1. Quantile | 2. Quantile | 3. Quantile | 4. Quantile | |
| Coil | 2663 | 2404 | 1803 | 996 |
| Strand | 495 | 798 | 1398 | 2017 |
| Helix | 1788 | 1805 | 1764 | 1959 |
1.3 Quantitative distribution of the amino acids within the four quantiles
Dataset: 114 non-redundat globular proteins
| 1. Quantile | 2. Quantile | 3. Quantile | 4. Quantile | Sum | |
| Ala | 23 | 327 | 1018 | 349 | 1717 |
| Arg | 253 | 651 | 203 | 1 | 1108 |
| Asn | 455 | 452 | 65 | 1 | 973 |
| Asp | 851 | 225 | 6 | 2 | 1084 |
| Cys | 0 | 3 | 78 | 337 | 418 |
| Gln | 220 | 475 | 102 | 2 | 799 |
| Glu | 1026 | 139 | 3 | 3 | 1171 |
| Gly | 397 | 760 | 447 | 12 | 1616 |
| His | 5 | 82 | 321 | 18 | 426 |
| Ile | 3 | 12 | 172 | 864 | 1051 |
| Leu | 7 | 21 | 407 | 1143 | 1578 |
| Lys | 942 | 91 | 3 | 3 | 1039 |
| Met | 2 | 8 | 89 | 271 | 370 |
| Phe | 1 | 11 | 147 | 528 | 687 |
| Pro | 393 | 442 | 117 | 0 | 952 |
| Ser | 241 | 692 | 349 | 2 | 1284 |
| Thr | 122 | 558 | 521 | 5 | 1206 |
| Trp | 0 | 8 | 148 | 174 | 330 |
| Tyr | 0 | 29 | 339 | 367 | 735 |
| Val | 5 | 21 | 430 | 890 | 1346 |
1.4 Energetic characterization of all amino acids according to secondary structure
Dataset: 114 non-redundant globular proteins (average free energy)
| Coil | Helix | Strand | |
| Ala | -11,40 | -14,94 | -17,79 |
| Arg | -4,53 | -5,78 | -7,50 |
| Asn | -3,14 | -4,17 | -5,67 |
| Asp | -0,85 | -1,76 | -2,87 |
| Cys | -22,32 | -27,56 | -28,22 |
| Gln | -3,63 | -5,20 | -7,07 |
| Glu | 0,02 | -0,63 | -2,02 |
| Gly | -5,06 | -7,29 | -10,51 |
| His | -10,69 | -12,71 | -14,41 |
| Ile | -23,16 | -27,71 | -31,13 |
| Leu | -21,02 | -25,66 | -29,32 |
| Lys | 0,24 | -0,85 | -1,62 |
| Met | -20,32 | -24,91 | -27,41 |
| Phe | -21,67 | -25,77 | -29,61 |
| Pro | -4,04 | -4,88 | -7,42 |
| Ser | -5,30 | -6,44 | -9,06 |
| Thr | -6,42 | -8,04 | -10,75 |
| Trp | -18,18 | -21,02 | -22,28 |
| Tyr | -16,70 | -18,70 | -23,53 |
| Val | -19,47 | -23,21 | -25,13 |
1.5 Quantitative distribution of all amino acids according to secondary structures
Dataset: 114 non-redundant globular proteins
| Coil | Helix | Sheet | Sum | |
| Ala | 523 | 885 | 309 | 1717 |
| Arg | 396 | 481 | 231 | 1108 |
| Asn | 541 | 297 | 135 | 973 |
| Asp | 533 | 405 | 146 | 1084 |
| Cys | 168 | 127 | 123 | 418 |
| Gln | 266 | 388 | 145 | 799 |
| Glu | 338 | 617 | 216 | 1171 |
| Gly | 1015 | 319 | 282 | 1616 |
| His | 163 | 158 | 105 | 426 |
| Ile | 252 | 354 | 445 | 1051 |
| Leu | 454 | 712 | 412 | 1578 |
| Lys | 414 | 433 | 192 | 1039 |
| Met | 92 | 188 | 90 | 370 |
| Phe | 190 | 267 | 230 | 687 |
| Pro | 643 | 233 | 76 | 952 |
| Ser | 606 | 402 | 276 | 1284 |
| Thr | 547 | 323 | 336 | 1206 |
| Trp | 101 | 142 | 87 | 330 |
| Tyr | 263 | 203 | 269 | 735 |
| Val | 361 | 382 | 603 | 1346 |
1.6 Energetic characterization of 3D-motifs
Dataset: 114 non-redundant globular proteins
Coarse-grained calculated energy values are given as averages.
Determined by PDBeMotif (for further information see Golovin A, Henrick K. MSDmotif: exploring protein sites and motifs. BMC Bioinformatics 2008, 9:312.)
In case of variable number of amino acids the total amount is given in brackets (betabulgeloop, niche, ststaple)
| 3D-Motif | 1. AA | 2. AA | 3. AA | 4. AA | 5. AA | 6. AA | eValue |
| alphabetamotif | -16,67 | -12,43 | -11,52 | -11,89 | -16,56 | -13,81 | |
| asxmotif | -2,2 | -7,25 | -4,40 | -11,65 | -13,43 | -7,79 | |
| asxturn | -2,34 | -8,41 | -4,79 | -5,18 | |||
| betabulge | -14,27 | -11,23 | -12,75 | ||||
| betabulgeloop (5) | -12,66 | -2,58 | -0,54 | -4,92 | -6,27 | -5,39 | |
| betabulgeloop (6) | -9,82 | -4,47 | -2,87 | -4,49 | -7,38 | -11,14 | -6,70 |
| betaturn | -13,55 | -9,24 | -7,82 | -9,90 | -10,13 | ||
| gammaturn | -7,22 | -14,41 | -8,53 | -10,05 | |||
| nest | -6,98 | -6,37 | -11,96 | -8,44 | |||
| niche (3) | -8,54 | -6,06 | -8,59 | -7,73 | |||
| niche (4) | -11,5 | -7,27 | -6,73 | -14,51 | -10,00 | ||
| schellmannloop | -20,15 | -12,16 | -6,61 | -9,23 | -3,92 | -15,10 | -11,20 |
| stmotif | -5,07 | -10,81 | -5,55 | -6,37 | -17,66 | -9,09 | |
| ststaple (5) | -13,31 | -13,51 | -13,22 | -14,65 | -9,24 | -12,79 | |
| ststaple (6) | -22,45 | -17,89 | -9,24 | -4,76 | -3,31 | -13,20 | -11,81 |
| stturn | -6,57 | -5,59 | -7,30 | -6,49 |
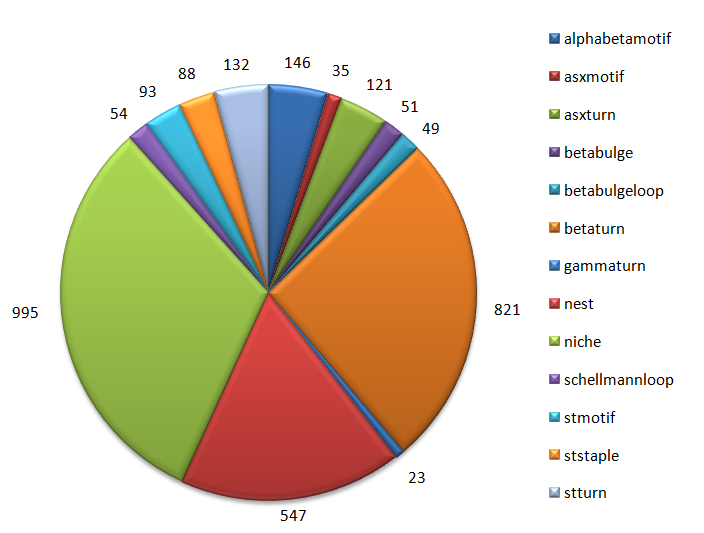
1.7 Quantitative distribution of 3D-motifs
Dataset: 114 non-redundant globular proteins
|
|
1.8 Quantitative distribution of the phi-angle within the four quantiles according to secondary structures
Dataset: 114 non-redundant globular proteins
| 1. Quantile | 2. Quantile | 3. Quantile | 4. Quantile | |||||
| angle | positive | negative | positive | negative | positive | negative | positive | negative |
| Coil | 438 | 2003 | 508 | 1940 | 137 | 1531 | 15 | 887 |
| Helix | 51 | 1610 | 72 | 1819 | 31 | 1686 | 2 | 1949 |
| Sheet | 16 | 437 | 44 | 795 | 26 | 1354 | 0 | 2017 |
1.9 Quantitative distribution of the psi-angle within the four quantiles according to secondary structures
Dataset: 114 non-redundant globular proteins
| 1. Quantile | 2. Quantile | 3. Quantile | 4. Quantile | |||||
| angle | positive | negative | positive | negative | positive | negative | positive | negative |
| Coil | 1533 | 908 | 1628 | 820 | 1283 | 385 | 730 | 172 |
| Helix | 242 | 1420 | 327 | 1564 | 194 | 1523 | 142 | 1809 |
| Sheet | 412 | 42 | 760 | 79 | 1261 | 119 | 1975 | 42 |
2. Alpha-helical membrane proteins
2.1 Amino acid-specific average coarse-grained energies
Dataset: 146 non-redundant membrane proteins
| overall | inside membrane | outside membrane | |
| Ala | 7.88 | 2.40 | 13.75 |
| Arg | 24.29 | 16.45 | 26.03 |
| Asn | 17.84 | 10.27 | 21.01 |
| Asp | 18.34 | 9.11 | 19.87 |
| Cys | 8.43 | 7.21 | 9.59 |
| Gln | 20.45 | 11.34 | 23.51 |
| Glu | 21.16 | 11.01 | 22.98 |
| Gly | 6.26 | -2.23 | 13.72 |
| His | 16.68 | 4.21 | 22.42 |
| Ile | 14.58 | 13.94 | 15.48 |
| Leu | 16.93 | 15.48 | 18.88 |
| Lys | 27.62 | 21.65 | 28.51 |
| Met | 14.51 | 10.27 | 19.15 |
| Phe | 11.97 | 10.64 | 13.85 |
| Pro | 14.83 | 5.05 | 18.97 |
| Ser | 10.02 | 1.21 | 15.73 |
| Thr | 13.33 | 7.05 | 17.79 |
| Trp | 15.17 | 14.56 | 15.81 |
| Tyr | 14.03 | 9.91 | 16.81 |
| Val | 13.11 | 11.73 | 14.73 |
2.2 Quantitative distribution of the secondary structures according to four energy quartiles
Dataset: 146 non-redundant membrane proteins
| inside | outside | |||||||
| quartile | 1. Q | 2. Q | 3. Q | 4. Q | 1. Q | 2. Q | 3. Q | 4. Q |
| Coil | 4 | 67 | 161 | 650 | 1451 | 1358 | 1345 | 1630 |
| Strand | 22 | 134 | 231 | 404 | 766 | 645 | 447 | 307 |
| Helix | 199 | 1565 | 3306 | 6440 | 2933 | 2527 | 1928 | 1801 |
2.3 Quantitative distribution of the amino acids according to energy quartiles
Dataset: 146 non-redundant membrane proteins
| inside | outside | |||||||||
| quartile | 1. Q | 2. Q | 3. Q | 4. Q | sum | 1. Q | 2. Q | 3. Q | 4. Q | sum |
| Ala | 0 | 0 | 4 | 1479 | 1483 | 167 | 427 | 331 | 462 | 1387 |
| Arg | 25 | 93 | 64 | 33 | 215 | 564 | 168 | 150 | 88 | 970 |
| Asn | 0 | 9 | 116 | 164 | 289 | 301 | 159 | 103 | 128 | 691 |
| Asp | 0 | 0 | 39 | 87 | 126 | 308 | 179 | 101 | 173 | 761 |
| Cys | 0 | 0 | 20 | 181 | 201 | 0 | 14 | 64 | 133 | 211 |
| Gln | 0 | 23 | 84 | 96 | 203 | 318 | 122 | 68 | 97 | 605 |
| Glu | 1 | 12 | 79 | 81 | 173 | 489 | 173 | 115 | 187 | 964 |
| Gly | 0 | 0 | 0 | 1160 | 1160 | 233 | 326 | 305 | 458 | 1322 |
| His | 0 | 0 | 1 | 163 | 164 | 189 | 61 | 40 | 66 | 356 |
| Ile | 19 | 390 | 707 | 300 | 1416 | 92 | 393 | 328 | 196 | 1009 |
| Leu | 105 | 847 | 928 | 278 | 2158 | 482 | 540 | 385 | 193 | 1600 |
| Lys | 65 | 61 | 19 | 8 | 153 | 672 | 196 | 106 | 51 | 1025 |
| Met | 0 | 18 | 160 | 250 | 428 | 138 | 113 | 75 | 65 | 391 |
| Phe | 2 | 58 | 465 | 591 | 1116 | 43 | 215 | 300 | 229 | 787 |
| Pro | 0 | 0 | 4 | 382 | 386 | 355 | 188 | 144 | 225 | 912 |
| Ser | 0 | 0 | 1 | 693 | 694 | 246 | 304 | 234 | 286 | 1070 |
| Thr | 0 | 1 | 51 | 616 | 668 | 292 | 253 | 174 | 220 | 939 |
| Trp | 5 | 91 | 166 | 47 | 309 | 38 | 99 | 100 | 61 | 298 |
| Tyr | 0 | 13 | 148 | 265 | 426 | 134 | 206 | 154 | 138 | 632 |
| Val | 5 | 154 | 642 | 620 | 1421 | 89 | 394 | 443 | 282 | 1208 |
2.4 Energetic characterization of all amino acids according to secondary structures
Dataset: 146 non-redundant membrane proteins
| inside | outside | |||||
| Coil | Helix | Strand | Coil | Helix | Strand | |
| Ala | 2,06 | 2,43 | 2,31 | 12,17 | 14,22 | 15,13 |
| Arg | 12,92 | 16,81 | 18,79 | 23,00 | 27,47 | 28,95 |
| Asn | 10,08 | 10,17 | 12,08 | 19,68 | 21,72 | 23,12 |
| Asp | 7,43 | 9,34 | 8,65 | 18,43 | 20,36 | 23,27 |
| Cys | 5,41 | 7,37 | 7,63 | 8,85 | 9,60 | 11,10 |
| Gln | 8,00 | 11,62 | 12,31 | 21,33 | 24,22 | 26,07 |
| Glu | 7,82 | 11,45 | 12,43 | 20,81 | 23,85 | 26,01 |
| Gly | -1,63 | -2,29 | -2,40 | 12,11 | 14,56 | 16,03 |
| His | 4,44 | 4,19 | 4,13 | 19,63 | 23,83 | 24,25 |
| Ile | 11,46 | 14,05 | 14,51 | 13,89 | 15,55 | 17,52 |
| Leu | 13,82 | 15,53 | 16,06 | 16,80 | 19,42 | 21,02 |
| Lys | 12,88 | 22,20 | 25,04 | 26,08 | 29,84 | 30,52 |
| Met | 9,42 | 10,27 | 10,91 | 17,70 | 19,75 | 19,64 |
| Phe | 9,00 | 10,78 | 10,13 | 13,00 | 14,01 | 15,07 |
| Pro | 4,03 | 5,16 | 5,65 | 18,15 | 19,03 | 21,87 |
| Ser | 0,26 | 1,31 | 1,15 | 15,04 | 16,01 | 16,88 |
| Thr | 6,01 | 7,16 | 6,81 | 16,81 | 18,29 | 18,42 |
| Trp | 11,44 | 14,72 | 14,80 | 14,02 | 16,36 | 17,25 |
| Tyr | 7,68 | 10,08 | 10,77 | 15,24 | 17,23 | 18,35 |
| Val | 10,46 | 11,77 | 12,13 | 12,59 | 15,00 | 16,53 |
2.5 Quantitative distribution of all amino acids according to secondary structures
Dataset: 146 non-redundant membrane proteins
| inside | outside | |||||||
| Coil | Helix | Strand | Sum | Coil | Helix | Strand | Sum | |
| Ala | 88 | 1307 | 88 | 1483 | 382 | 863 | 142 | 1387 |
| Arg | 29 | 168 | 18 | 215 | 347 | 518 | 105 | 970 |
| Asn | 19 | 254 | 16 | 289 | 290 | 329 | 72 | 691 |
| Asp | 14 | 109 | 3 | 126 | 310 | 373 | 78 | 761 |
| Cys | 17 | 182 | 2 | 201 | 74 | 102 | 35 | 211 |
| Gln | 18 | 174 | 11 | 203 | 194 | 339 | 72 | 605 |
| Glu | 25 | 133 | 15 | 173 | 352 | 505 | 107 | 964 |
| Gly | 112 | 972 | 76 | 1160 | 532 | 656 | 134 | 1322 |
| His | 17 | 132 | 15 | 164 | 123 | 196 | 37 | 356 |
| Ile | 71 | 1272 | 73 | 1416 | 263 | 560 | 186 | 1009 |
| Leu | 104 | 1905 | 149 | 2158 | 455 | 938 | 207 | 1600 |
| Lys | 13 | 127 | 13 | 153 | 384 | 519 | 122 | 1025 |
| Met | 24 | 373 | 31 | 428 | 112 | 238 | 41 | 391 |
| Phe | 58 | 979 | 79 | 1116 | 232 | 449 | 106 | 787 |
| Pro | 45 | 325 | 16 | 386 | 420 | 382 | 110 | 912 |
| Ser | 62 | 596 | 36 | 694 | 427 | 519 | 124 | 1070 |
| Thr | 51 | 582 | 35 | 668 | 325 | 505 | 109 | 939 |
| Trp | 16 | 271 | 22 | 309 | 85 | 174 | 39 | 298 |
| Tyr | 35 | 371 | 20 | 426 | 189 | 344 | 99 | 632 |
| Val | 64 | 1284 | 73 | 1421 | 288 | 680 | 240 | 1208 |